So we’ve all be in lockdown here in Sydney for several weeks and what betting topic to take on as a lockdown project than the COVID-19 pandemic itself.
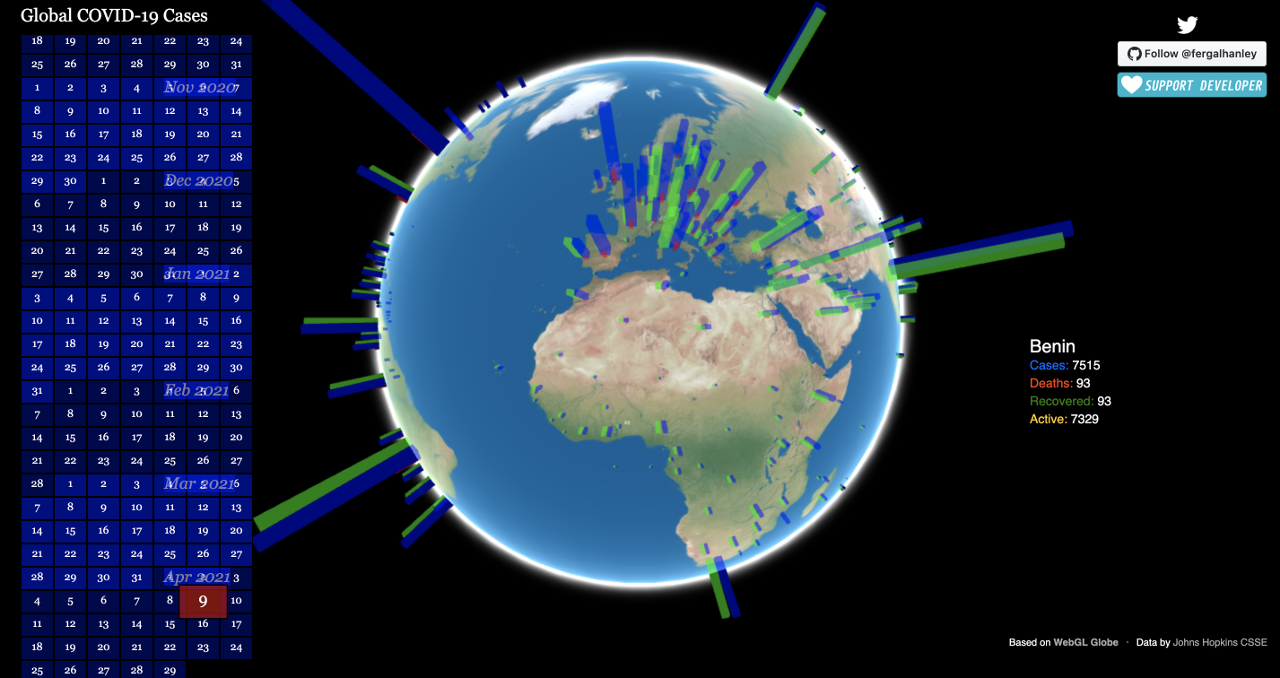
I’ve built this WebGL based 3D globe graph of the COVID-19 pandemic time series data. It’s built using TypeScript with Three.js and based on Google’s WebGL Globe project.
The data was sourced from the COVID-19 Data Repository by the Center for Systems Science and Engineering (CSSE) at Johns Hopkins University which they maintain on GitHub here. This is the same data they use to populate their famous visual dashboard.
I basically use a shell script to sycn the CSSEGISandData data locally then a Node script is run across the repository
to generate my data file covid-data.json which is loaded by the client when it starts up.
In the design I’ve played with the idea that the user can see the entire series of data at a glance by running their mouse over the calendar grid.